- Screen Reader Access
- Skip to : main content / navigation
-
- Text Size
- Home
- Sitemap
- Contact us
- हिंदी


1.Deep Seismological observations in the Indian Ocean
To understand the Earth’s interior at different scales NCPOR carries out deep seismic observations under the IOGL program by deploying broad-band seismometers for short term as well as long term measurements.
Short term (active) Ocean Bottom Seismometer (OBS) deployments
In 2015, research team at NCPOR carried out a marine geophysical experiment onboard R/V GeoHind Sagar in the northern part of Central Indian Ocean Basin (CIOB), around the IOGL anomaly (Fig. 1). The geophysical data consist of a ~ 420 km long wide-angle reflection and refraction (WARR) seismic profile with deployment of 12 Ocean Bottom Seismometers (OBS) (Fig. 1). The E-W oriented OBS profile, south of Sri Lanka, traverses the southern ends of the CR. A ~1600 km long deep penetrating multi-channel seismic (MCS) profile IOGL-03 was also acquired simultaneously extending between the CR and the eastern flanks of the 90E ridge. A couple of N-S intersecting MCS profiles (IOGL-01 and 02) were also acquired in this region (Fig. 1). The broadband OBSs were equipped with four components comprising three orthogonal geophones and a hydrophone. The experiment aimed to delineate crustal and upper mantle variations in the CIOB and adjoining basins.

Fig. 1 Active OBS deployment map showing E-W OBS profile in the CIOB.
|
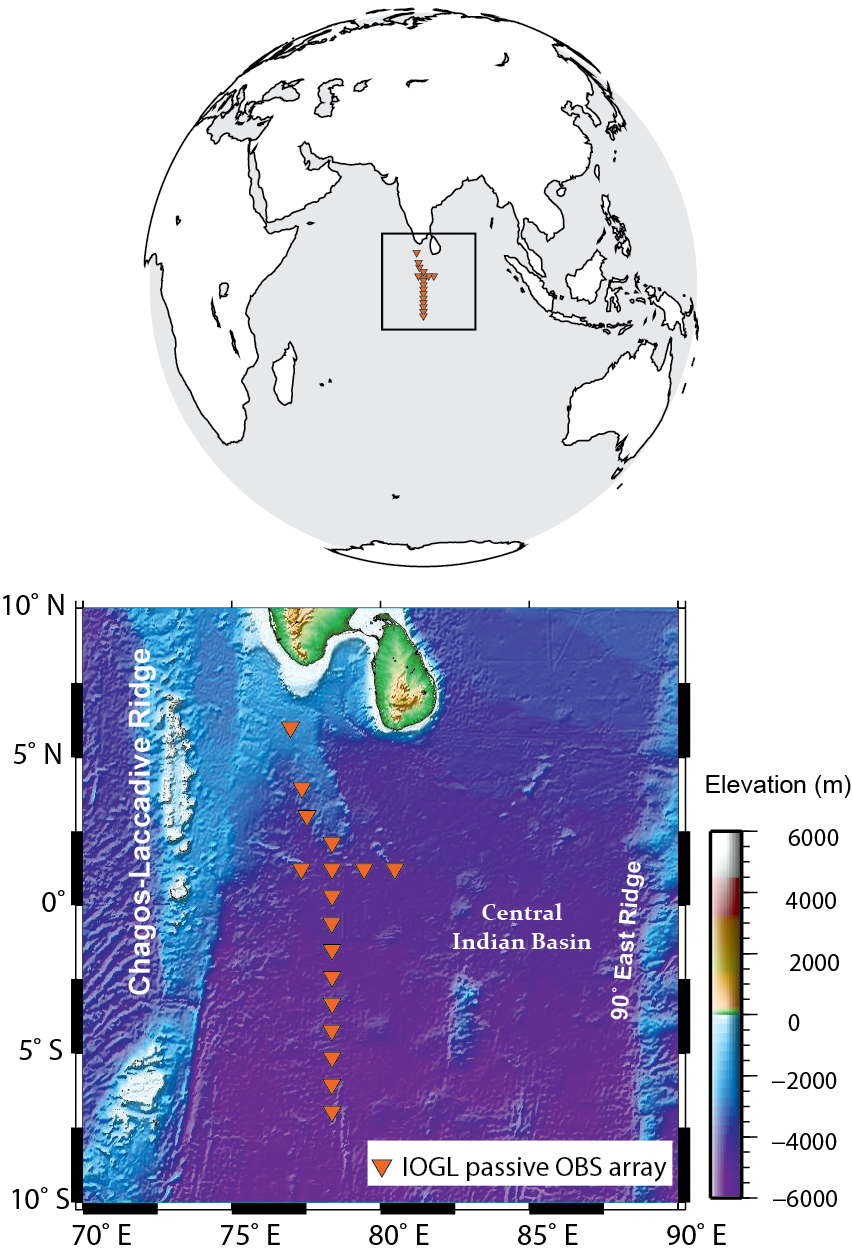
Long term (passive) Ocean Bottom Seismometers (OBSs)
A passive seismic array is a linear network of seismometers that detect natural low frequency earth movements for discerning crustal and deep mantle structures. Under the IOGL program, a large passive seismic array consisting of 17 broadband OBSs were deployed in the northern part of the Indian Ocean (Fig. 2). The OBS units are equipped with Trillium compact 120 seismometers; a digitizer with a dynamic range of -3 dB at 120 s and 100 Hz; and a hydrophone. The hydrophone has a frequency response of 0.01 Hz - 8 kHz. These OBSs stayed in the Indian Ocean water at depths that vary between 2300 and 5200 m below mean sea level. The seismological data have been gathered for a duration of more than 2 years since May 2018 in two different phases. [For details refer to- https://doi.org/10.1785/0220200034 https://doi.org/10.1029/2019EO120243]
What Passive OBS data can offer? Long term seismological observations can help understand diverse characteristics of the Earth, e.g., Oceanic crustal and deep mantle structures, Ocean-seismic noises, underwater hazards (volcanic tremors and landslides), climatological disturbances (cyclones), monitoring marine mammal habitats). In this experiment we also aim to utilize this data for variety of scientific tasks.
|
|
Fig. 2 IOGL passive seismic array.
2. Thick and underplated oceanic crust: Evidence of extensive plume ridge interaction
Two-dimensional travel-time tomographic inversion complemented by potential field modelling of active OBS deployments provided sub-surface velocity-interface variations beneath the CIOB crust. Results demonstrate presence of an anomalously thick crust (~14 km) underneath the Comorin ridge, which gradually thins out in the east near the centre of the geoidal low. We observe distinct evidence for an anomalously high velocity lower crust (velocities greater than 7 km/s across a ~ 160 km wide region) west of 790 E longitude. However, crust to the east of this point appears to be normal oceanic type. We attribute the lateral diversity in the crustal type to possible magmatic underplating beneath the Comorin ridge. We infer that the late Cretaceous India-Madagascar break-up, which was accompanied with extensive plume-ridge interaction, produced excess melt leading to the observed crustal underplating. These findings have significant implications towards better understanding of plume-ridge interaction processes along various passive margins as well as precise reconstruction of India-Madagascar dispersal (Fig. 3). [For details please see: Ningthoujam et al., 2022]

Fig 3. Schematic diagram showing the Plume-ridge interaction during the India-Madagascar break-up around 90 Ma.
3. Geotectonic models to understand the intraplate deformation
Using multi-channel seismic data and core-log integration as well as geo-potential data modelling we also attempt to develop a sedimento-crustal geodynamic model for this region. A geotectonic model enables to understand the early rifting and associated deformation in the oceanic basins and adjoining geological structures. This can validate the evidences obtained from the deep seismic refraction analyses in the Indian Ocean Basin thereby to understand the crustal-mantle structures and associated geodynamics. [For more details please see Pandey et al., 2022]
4. Mysterious thin Lithosphere and thick-low velocity zone underneath IOGL
Indian plate has experienced an interaction with numerous mantle plumes since the break-up and dispersal of the Gondawanaland super-continent. Finally the northward rift-drift journey of the Indian plate culminated into collision with the Eurasian plate. In this journey, Indian Ocean was formed. Situated in the central Indian Ocean, the IOGL region contains imprints of several mysterious tectonic features. The geoscience team at NCPOR made an attempt to explore one such enigmatic feature in form of the largest geoid low on Earth. Besides crustal observations, we used surface wave modelling approaches to characterize the lithosphere beneath the IOGL region. Our long-term observations provide the shear wave velocity variations in the uppermost mantle upto ~400 km depth. Results reveal a thin lithosphere and thick LVZ (low-velocity zone) in the geoid low region in comparison to the normal oceanic regime. We use these anomalous observations to explore possible role of African large low shear velocity province (LLVSP) and deep mantle plume in creating the Indian Ocean Geoid Low.[More details: Kumar et al., 2022, in review]
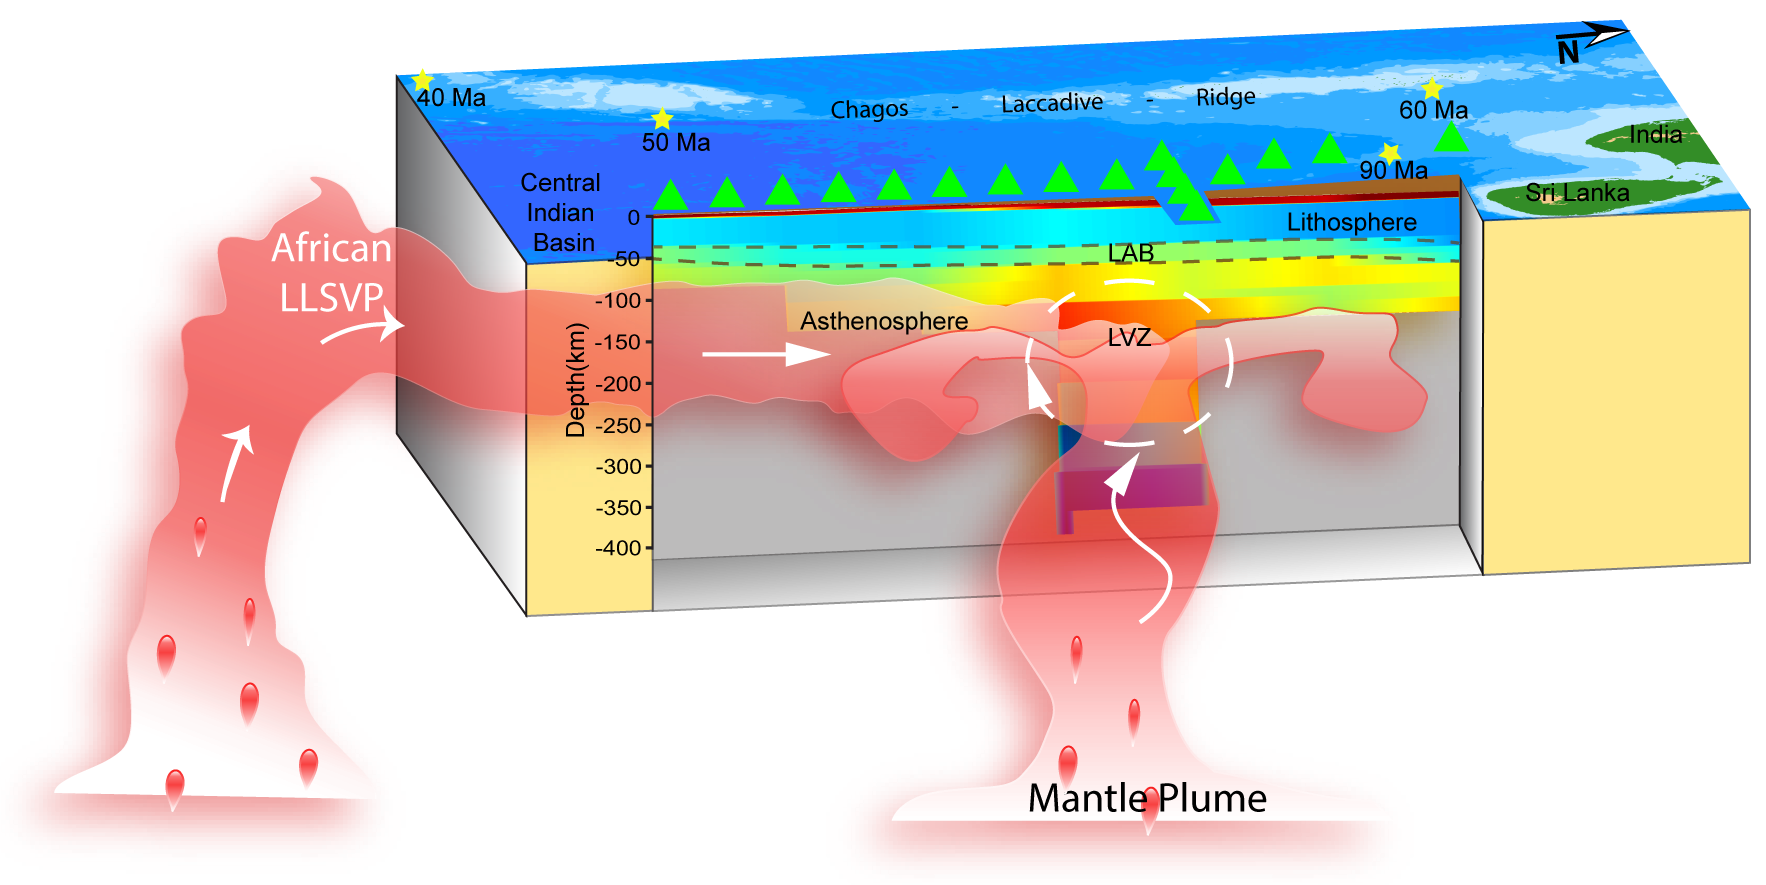
Fig 4. A schematic diagram showing thin lithosphere and thick low velocity zone in the upper mantle beneath the IOGL region. The triangle in green shows the IOGL-OBS array.
5. Teleseismic observations shows a hot mantle upwelling; A link to the source of IOGL
Our recent findings shed light on the topography of the Mantle Transition Zone (TZ) and show a colossal depression along ~800 km long TZ beneath the Indian Ocean Geoid Low (IOGL) region. This study shows the first quantitative evidence of extremely hot mantle upwelling beneath the IOGL region and presents a plausible explanation for the source of the highest geoid low (IOGL) on Earth. Our study highlights a successful large array Ocean Bottom Seismometer (OBS) study in India under the IOGL programme, MoES, Govt. of India and opens new avenues in Marine Seismology in India. [For more details refer to Negi et al., 2022 https://doi.org/10.1016/j.tecto.2022.229330]
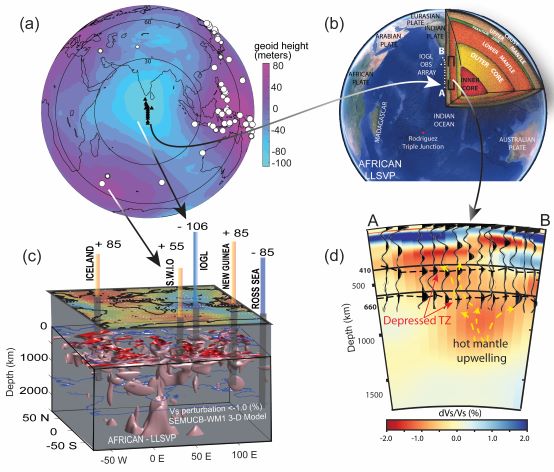
Figure 5. (a) The geoid map shows the OBS array in the Indian Ocean and the teleseismic earthquakes used for Ps receiver function study. (b) A spatial view of the area of investigation along the IOGL array with respect to the super plume, the African LLSVP. (c) The 3D velocity perturbation model for SEMUCB-WM1 (French and Romanowicz, 2015), highlighting low velocity material beneath various geoid anomalies globally. (d) The receiver functions image along IOGL profile A-B showing depression in the d410 and d660 boundary.
6. Stochastic Seismic Noise
Can we convert noisy data into a worthy set of information? To address this issue, we worked on designing a tool that reduces the seismic noise from the earthquake dataset. A paper published in Seismological Research Letters, 2021, aims to reduce stochastic noise based on the concept of a data-adaptive polarization algorithm. (For more details please refer to Negi et al., 2021 https://doi.org/10.1785/0220200034)
Facilities

HPC at IITM Geophysical Data Processing at NCPOR
1. Access to High Performance Computing (HPC) Pratyush – IITM, Pune.
2. Geophysical Processing and interpretation:
· Promax™
· GeoGraphix
· Kingdom-suite
· MOVE
· Geosoft-Oasis-Montaj
· Tesseral-Pro
3. Programming Platform: MATLAB suite
4. Image Processing and interpretation
Arc-GiS, Adobe Suite
Recent Publications